Range that likely contains the true population mean, from your sample stats.
Results are estimates for planning purposes and are not financial, medical, or professional advice.
How to Use the Confidence Interval Calculator
A confidence interval gives a range of plausible values for a population mean based on sample data. This calculator builds the interval for one sample mean and shows the margin of error behind it.
- Enter the sample mean from your data.
- Enter the sample standard deviation.
- Enter the sample size, n.
- Select the confidence level: 90, 95 or 99 percent.
- Calculate to see the lower and upper bounds and the margin of error.
Confidence Interval Calculator Formula
The interval is the sample mean plus or minus the critical value times the standard error: mean ± z × (s ÷ √n). The calculator uses z values of 1.645 for 90 percent, 1.96 for 95 percent and 2.576 for 99 percent, so it applies the normal approximation. For very small samples a t-interval would be slightly wider, since t exceeds z.
Example Calculation
A class of 40 students has a mean test score of 50 and a standard deviation of 10. The standard error is 10 ÷ √40, or 1.58. At 95 percent confidence the margin is 1.96 × 1.58, or 3.10, giving an interval of 46.90 to 53.10.

How to Interpret Your Interval
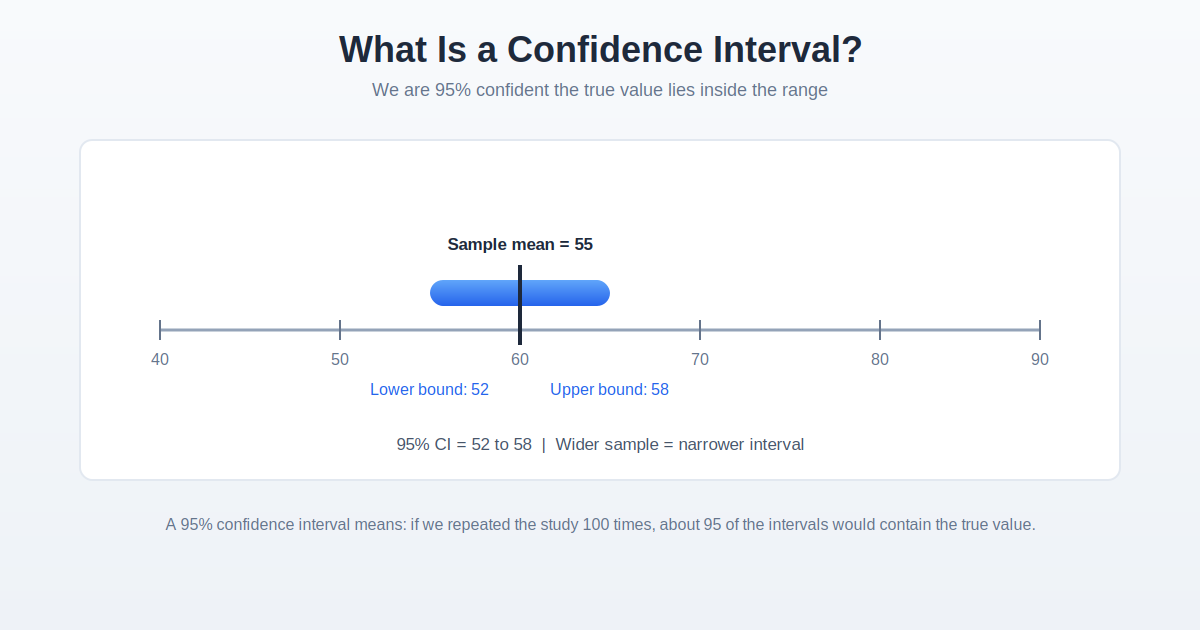
Read the result as a range, not as a probability for one fixed answer. The 95 percent describes the method: across many repeated samples, about 95 percent of intervals built this way would capture the true population mean. A narrow interval signals precision; a wide one warns of limited information.
Planning a Sample Size
Precision improves slowly, because the standard error shrinks with √n: quadrupling the sample only halves the margin. Moving from n of 40 to n of 160 in the example cuts the margin from 3.10 to 1.55, so decide your acceptable margin first, then solve for n.
Frequently Asked Questions
What does 95 percent confidence actually mean?
It means that if you repeated the sampling process many times, about 95 percent of the intervals you compute would contain the true population value, not that there is a 95 percent chance the true value is in this one interval.
Why does a larger sample give a narrower interval?
The standard error divides by the square root of n, so quadrupling the sample size halves the margin of error and pins the estimate down more precisely.
When should I use a t-interval instead of a z-interval?
Use t when the sample is small (roughly under 30) and the standard deviation was estimated from the data. With large samples, z and t are nearly identical.
What is the margin of error?
It is the plus-or-minus amount around your estimate: the critical value times the standard error. It quantifies sampling uncertainty alone.
Can I compare two groups with confidence intervals?
Comparing two groups needs a two-sample interval for the difference, a different calculation from this single-mean tool. If that interval excludes zero, the groups differ at that confidence level.
How does the confidence level change the width of the interval?
A higher level uses a larger critical value, so the interval widens. For mean 50, standard deviation 10 and n 40, the margin is 2.60 at 90 percent, 3.10 at 95 percent and 4.07 at 99 percent.
How many samples do I need for a target margin of error?
Use n equals (critical value × standard deviation ÷ target margin) squared, rounded up. For standard deviation 10, target margin 1 and 95 percent, n is 384.16, so at least 385.
Related Calculators
Try our Standard Deviation Calculator and Percentage Calculator for more statistics tools.