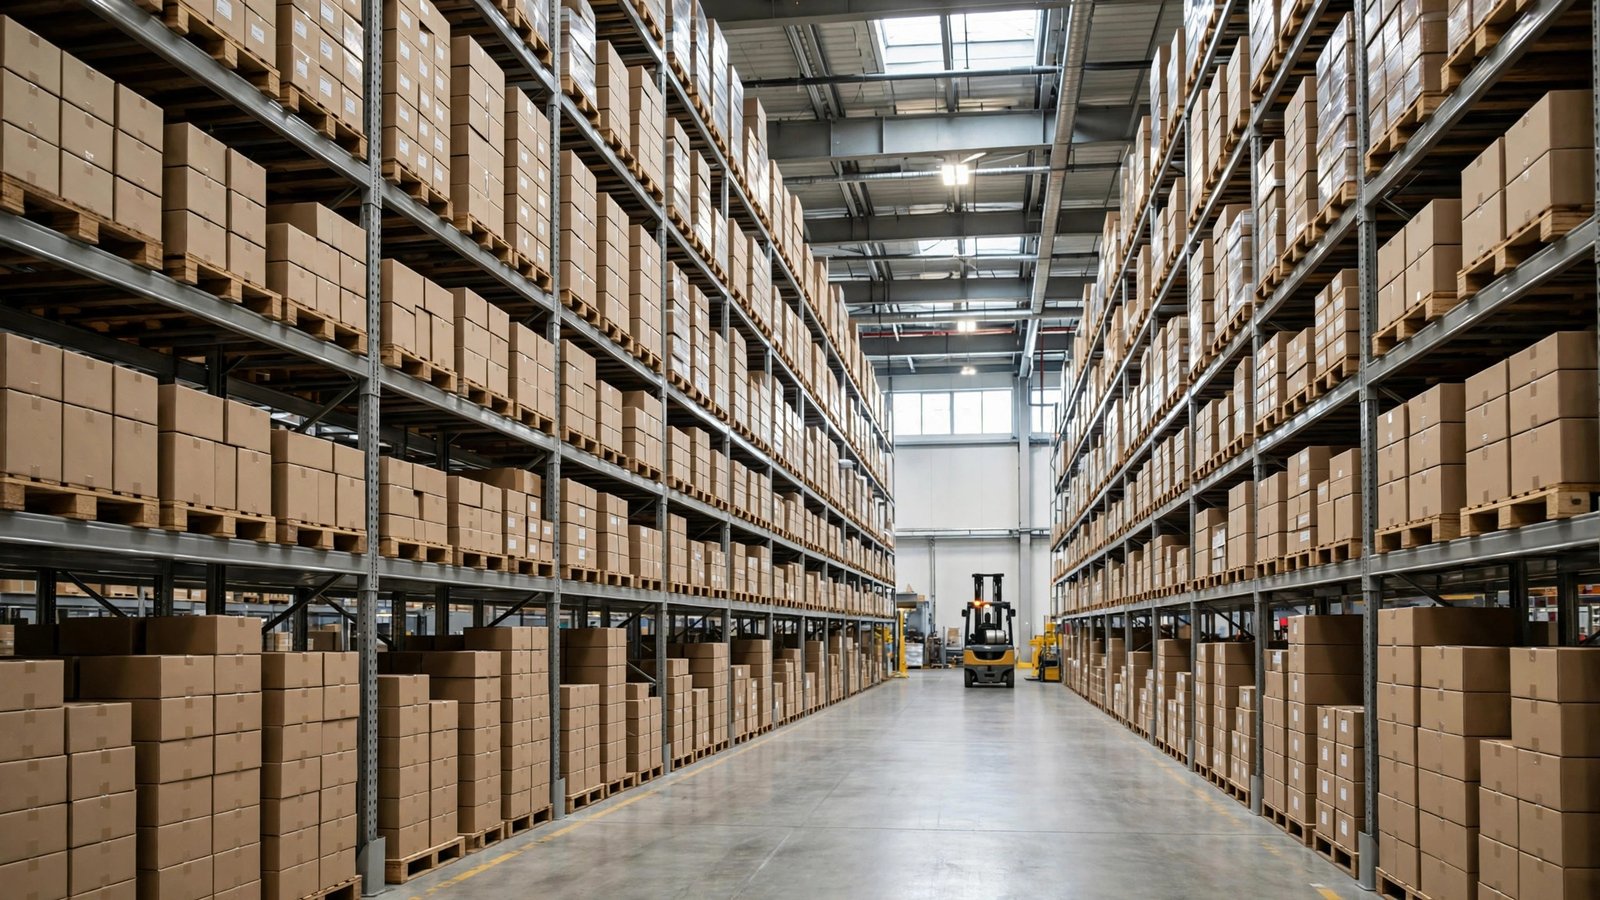
The Classic Inventory Dilemma, Solved With One Formula
Order in bulk and cash sits on shelves gathering dust (and rent, insurance, and spoilage risk). Order tiny batches and you’re forever paying shipping, handling, and paperwork. The economic order quantity (EOQ) is the order size where these two costs balance at their combined minimum — a formula nearly a century old and still the starting point of inventory planning.
This free EOQ calculator takes your annual demand, cost per order, and holding cost per unit, then returns the optimal order quantity, how many orders that means per year, the days between them, and the annual ordering and holding costs — which, at the optimum, are equal.
Demand · order cost · holding cost → optimal order
Please enter positive annual demand, ordering cost, and holding cost per unit.
EOQ assumes steady demand, fixed order costs, and no stockouts — at the optimum, ordering and holding costs are equal. Round to a whole number your supplier accepts.

How to Use This Calculator
- Enter annual demand — units you expect to sell in a year.
- Enter ordering cost per order — the fixed cost of placing one order: shipping, handling, admin.
- Enter holding cost per unit per year — storage, insurance, spoilage, and tied-up capital per unit.
- Click Calculate EOQ — read the optimal quantity, order rhythm, and cost split.
Getting Your Three Inputs Right
The formula is the easy part; honest inputs are where EOQ succeeds or fails. For annual demand, use the last 12 months of actual unit sales or production usage — and keep the unit consistent (units, not cases, unless everything else is in cases too). For ordering cost, add up what one order really costs you: the buyer’s time, supplier follow-up, receiving and inspection labour, invoice processing and payment fees. Businesses that assume this is “basically zero” get EOQs that are far too small. For holding cost, the usual shortcut is a carrying rate of 20–30% of the item’s landed unit cost (price plus freight and duties) per year, covering storage, insurance, spoilage, obsolescence and the cost of the cash tied up in stock. Multiply the rate by the unit cost to get H.
The Formula
D = annual demand, S = ordering cost per order, H = holding cost per unit per year. Also: orders/year = D ÷ EOQ.
Worked example
Annual demand 10,000 units, $100 per order, $50 holding cost per unit per year:
- EOQ = √(2 × 10,000 × 100 ÷ 50) = √40,000 = 200 units.
- Orders per year: 10,000 ÷ 200 = 50 (about every 7.3 days).
- Annual ordering cost: 50 × $100 = $5,000; annual holding cost: 100 × $50 = $5,000 — equal, as theory promises.
Why the Formula Works: Two Costs Pulling in Opposite Directions
Every order quantity you choose creates two bills. The ordering bill is the number of orders you place in a year (annual demand D divided by order size Q) multiplied by the fixed cost of each order (S). Order in bigger batches and this bill shrinks, because you place fewer orders. The holding bill works the other way: on average you store half of each batch (Q/2 units), and each unit costs H per year, so bigger batches make this bill grow. Add them together and you get the total annual inventory cost:
EOQ is simply the order size where this total bottoms out — and at that exact point the two bills are always equal. That is why the worked example above lands on $5,000 of ordering cost and $5,000 of holding cost: the balance is not a coincidence, it is how you know you have found the optimum.
One consequence surprises many people: because of the square root in the formula, EOQ grows more slowly than demand. If your sales double, your optimal order size rises by only about 41%, not 100%. Growing businesses should therefore order more often, not simply supersize every batch.
A second worked example: a coffee roaster
A small coffee roaster sells 6,000 bags of beans a year (D = 6,000). Each supplier order costs $40 in delivery and admin time (S = $40), and storing one bag for a year costs $3 once rent, insurance and tied-up cash are counted (H = $3).
- EOQ = √(2 × 6,000 × 40 ÷ 3) = √160,000 = 400 bags per order.
- Orders per year: 6,000 ÷ 400 = 15 (about every 24 days).
- Annual ordering cost: 15 × $40 = $600; annual holding cost: 200 × $3 = $600. Total: $1,200 a year — the cheapest rhythm available.
Order 200 bags at a time instead and the total climbs to $1,500 (30 orders × $40 = $1,200 ordering, plus $300 holding). Order 800 at a time and it also reaches $1,500 ($300 ordering, $1,200 holding). Deviating from the EOQ in either direction costs the same business an extra $300 a year on this one product alone.
From the Textbook to the Loading Dock: Packs, Minimums and Discounts
Real suppliers rarely let you order exactly 400 of anything. Three adjustments turn the textbook answer into a workable order:
- Pack sizes. If your EOQ is 400 but the supplier ships cases of 48, compare the feasible neighbours — 384 and 432 — with the total cost formula above and pick the cheaper one. Do not assume rounding up is always best; check both sides, because the cost curve is not symmetric once you leave the optimum.
- Minimum order quantities (MOQs). If the supplier’s minimum is above your EOQ, the minimum wins — you cannot order less than they will sell. Your real choice is then between accepting the MOQ, negotiating, or finding another supplier.
- Quantity discounts. A lower unit price for bigger orders can be worth real money, but only a total-cost comparison tells you. Example: with annual demand of 50,000 units, a $200 ordering cost and an $8 holding cost, the EOQ is about 1,581 units at a $30 unit price (total annual cost ≈ $1,512,649 including the $1,500,000 purchase cost). A supplier offers $29.40 per unit for orders of 2,500 or more. Ordering 2,500 at a time raises the ordering-plus-holding bill from $12,649 to $14,000, but cuts the purchase bill by $30,000 — total ≈ $1,484,000. The discount wins by roughly $28,649 a year, despite the larger batches.
The lesson is not “always chase discounts” — it is that EOQ gives you the baseline to compare against, and any deviation should have to justify itself with numbers.
Who This Helps and Smart Tips
- E-commerce sellers deciding restock quantities without gut feel.
- Operations managers cutting the combined cost of ordering and warehousing.
- Students learning the foundational model of inventory theory.
Tips
- Round to a whole number your supplier actually accepts — 199.4 units isn’t orderable.
- EOQ assumes steady demand; add safety stock for spikes and supplier delays.
- Recompute when costs change — freight hikes and rent increases move the optimum.
- For multiple products, run EOQ per SKU; shared order costs need fancier models.
- Set reorder points (not just quantities) so the next order triggers automatically.
Frequently Asked Questions
What is economic order quantity in simple terms?
It is the order size that minimizes your total inventory cost. Bigger orders cut ordering costs but raise holding costs; smaller orders do the reverse. EOQ is the quantity where the two are balanced and their sum is lowest.
What are the assumptions behind EOQ?
Steady known demand, fixed ordering cost, constant holding cost, no stockouts, instant replenishment, and one product at a time. Real life violates several — treat EOQ as the starting point, then adjust for variability with safety stock.
How do you calculate holding cost per unit?
Add up everything inventory costs you per year — warehouse rent, insurance, spoilage, obsolescence, and the capital tied up — then divide by average units held. Many businesses land between 20% and 30% of the unit’s value per year.
Should I round EOQ up or down?
Round to the nearest whole number your supplier allows; the cost curve is flat near the optimum, so small rounding barely matters. When in doubt, round up slightly to reduce stockout risk.
What is the difference between EOQ and reorder point?
EOQ answers how much to order; the reorder point answers when — the inventory level that triggers the next order, based on lead-time demand plus safety stock. You need both for a working system.
Does EOQ work for services or digital products?
Rarely — with no physical holding cost, the model collapses. EOQ shines for physical goods with real storage costs and meaningful per-order expenses.
What is the total annual inventory cost at the EOQ?
At the optimum, annual ordering cost and annual holding cost are equal, so the total is twice either one: Total = (D ÷ Q) × S + (Q ÷ 2) × H. For the coffee roaster example on this page, that is $600 + $600 = $1,200 per year. Ordering more or less often than the EOQ always raises this total.
How do quantity discounts and minimum order quantities change EOQ?
They can override it. If a supplier minimum (MOQ) is larger than your EOQ, you must order at least the minimum. A quantity discount may also justify ordering more than the EOQ — but only when the purchase savings beat the extra holding cost. Compare the full annual cost (purchase + ordering + holding) at the EOQ against the cost at the smallest order that earns the discount, and choose the cheaper total.
Final Thoughts
EOQ won’t run your warehouse for you, but it replaces guesswork with a defensible number — and the cost breakdown shows exactly what each order rhythm costs. Start here, then layer on safety stock and reorder points.
Manage the money side with our sales tax calculator and discount calculator.
Try the EOQ Calculator now
Free, no signup, works on any device. Explore more financial calculators.