What Is Variance?
Variance is a statistical measurement that describes how far a set of numbers spreads out from its average value. When you use a variance calculator, you enter a list of numbers and it tells you a single value that summarizes the dispersion of your data. A low variance means the numbers cluster tightly around the mean, while a high variance means they are spread widely apart.
Consider two groups of exam scores. Group A scores are 78, 80, 82, 79, and 81. Group B scores are 55, 70, 85, 95, and 95. Both groups have a mean of 80, yet they tell very different stories. Group A is consistent, while Group B is unpredictable. Variance captures exactly that difference: Group A has a small variance and Group B has a large one. The mean alone hides this; variance reveals it.
Variance is the foundation of many statistical methods. It appears in finance for measuring investment risk, in manufacturing for quality control, in science for experimental error, and in machine learning for feature scaling. Understanding variance is one of the most practical statistical skills you can develop, and this calculator handles the arithmetic so you can focus on interpretation.
Population Variance vs Sample Variance
There are two kinds of variance, and choosing the right one matters. Population variance is used when your numbers represent the entire group you care about — every member, with nothing left out. Sample variance is used when your numbers are only a subset drawn from a larger group, and you want to estimate the variance of the whole group from that subset.
The difference is in the denominator. Population variance divides the sum of squared deviations by n, the number of values. Sample variance divides by n minus 1 instead. This small adjustment, called Bessel’s correction, compensates for the fact that a sample tends to underestimate the true spread of the full population. With large data sets the difference is tiny, but with small samples it is significant.
As a rule of thumb: if you measured every student in a single classroom and only care about that classroom, use population variance. If you surveyed 50 voters to estimate the behavior of millions, use sample variance. When in doubt, sample variance is the safer default for inferential work.
The Variance Formula
The population variance formula is: variance = sum of (each value minus the mean) squared, divided by n. In symbols, σ² = Σ(xᵢ − μ)² / n, where μ is the population mean and n is the count of values.
The sample variance formula is nearly identical: s² = Σ(xᵢ − x̄)² / (n − 1), where x̄ is the sample mean. The only change is dividing by n − 1 instead of n.
Why square the deviations? Two reasons. First, squaring makes all deviations positive, so values above and below the mean do not cancel each other out. Second, squaring penalizes larger deviations more heavily, which matches how we intuitively think about spread — one extreme outlier should matter more than several tiny wiggles. The trade-off is that variance is expressed in squared units (for example, squared dollars), which is why people often take its square root to get the standard deviation in original units.
How Variance Changes When Your Data Changes
Two rules are worth knowing before you transform data. Adding the same constant to every value — awarding every student 10 bonus points, say — does not change the variance at all, because every deviation from the mean stays exactly the same. Multiplying every value by a constant k multiplies the variance by k² (and the standard deviation by |k|): convert a data set from metres to centimetres and its variance grows by 100² = 10,000, even though the data has not really become more spread out — only its units have changed.
How to Use This Variance Calculator
Using the calculator takes less than a minute:
Step 1: Enter your numbers
Type or paste your data set into the input box. Separate numbers with commas, spaces, or line breaks — the calculator accepts all three. For example: 4, 8, 6, 5, 3, 7.
Step 2: Choose population or sample
Select “Population variance” if your data covers the entire group, or “Sample variance” if it is a subset. The calculator adjusts the denominator automatically.
Step 3: Calculate and read the results
Press the button to see the count, mean, sum of squared deviations, variance, and standard deviation, along with a full step-by-step working so you can verify every stage of the computation.
Worked Example
Let us calculate the population variance of the data set 4, 8, 6, 5, 3, 7 by hand to see what the calculator does.
Step 1: Find the mean. Add the numbers: 4 + 8 + 6 + 5 + 3 + 7 = 33. Divide by 6: the mean is 5.5.
Step 2: Subtract the mean from each value and square the result: (4 − 5.5)² = 2.25, (8 − 5.5)² = 6.25, (6 − 5.5)² = 0.25, (5 − 5.5)² = 0.25, (3 − 5.5)² = 6.25, (7 − 5.5)² = 2.25.
Step 3: Add the squared deviations: 2.25 + 6.25 + 0.25 + 0.25 + 6.25 + 2.25 = 17.5.
Step 4: Divide by n = 6 for population variance: 17.5 / 6 = 2.9167. For sample variance, divide by 5 instead: 17.5 / 5 = 3.5.
Step 5: The standard deviation is the square root: about 1.7078 for the population version. The calculator above reproduces exactly these steps for any data set you enter.
Completing the Opening Example
Now the two groups from the introduction can be settled. Group A (78, 80, 82, 79, 81) has mean 80 and deviations −2, 0, 2, −1, 1; their squares sum to 10, so the population variance is 10 ÷ 5 = 2. Group B (55, 70, 85, 95, 95) also has mean 80, but its deviations are −25, −10, 5, 15, 15 and their squares sum to 1,200, giving a population variance of 1,200 ÷ 5 = 240. Same mean, yet Group B’s variance is 120 times larger — exactly the spread difference your eye sees in the raw scores.
Variance vs Standard Deviation
Variance and standard deviation describe the same spread, but in different units. Standard deviation is simply the square root of variance, which returns the measurement to the original units of the data. If your data is in centimeters, variance is in square centimeters while standard deviation is in centimeters — far easier to interpret.
So why use variance at all? Because variance has nicer mathematical properties. Variances of independent variables add together; standard deviations do not. Many statistical formulas, from analysis of variance to portfolio theory, are built on variance. In practice, compute the variance for the math, then report the standard deviation for human understanding. This calculator gives you both.
Why Variance Matters in Real Life
In finance, variance (and its square root, volatility) measures investment risk. Two funds might both average 8 percent annual returns, but the one with higher variance is the riskier ride. In manufacturing, variance in part dimensions determines defect rates — tighter variance means more consistent products. In education, test score variance helps distinguish a uniformly strong class from one with a wide achievement gap. In sports analytics, a player with low variance in performance is the reliable pick, even if another player has a slightly higher average. Wherever consistency matters, variance is the number to watch.
Common Mistakes to Avoid
The most frequent mistake is mixing up population and sample variance. Students and analysts routinely divide by n when they should divide by n minus 1, or vice versa. Before calculating, always ask: does my data represent everything I care about, or just a sample? A second common error is forgetting to square the deviations — simply averaging the raw deviations always gives zero, because positive and negative deviations cancel. The squaring step is not optional; it is the heart of the formula. A third mistake is comparing variances of data sets measured in different units. A variance of 25 in one data set and 4 in another tells you nothing about relative spread unless the units and scales are comparable — use the coefficient of variation (standard deviation divided by mean) when you need a unit-free comparison.
Variance in Spreadsheets and Code
If you work with data regularly, you will meet variance functions everywhere. In Excel and Google Sheets, VAR.P computes population variance and VAR.S computes sample variance for a list of cells. In Python, the statistics module offers pstdev and stdev for population and sample standard deviation — square them for variance — while NumPy’s var function takes a ddof parameter (0 for population, 1 for sample). In R, the var function computes sample variance by default. Knowing which default your tool uses prevents silent errors: always check whether a function divides by n or n minus 1 before trusting its output in a report.
How to Interpret Your Result
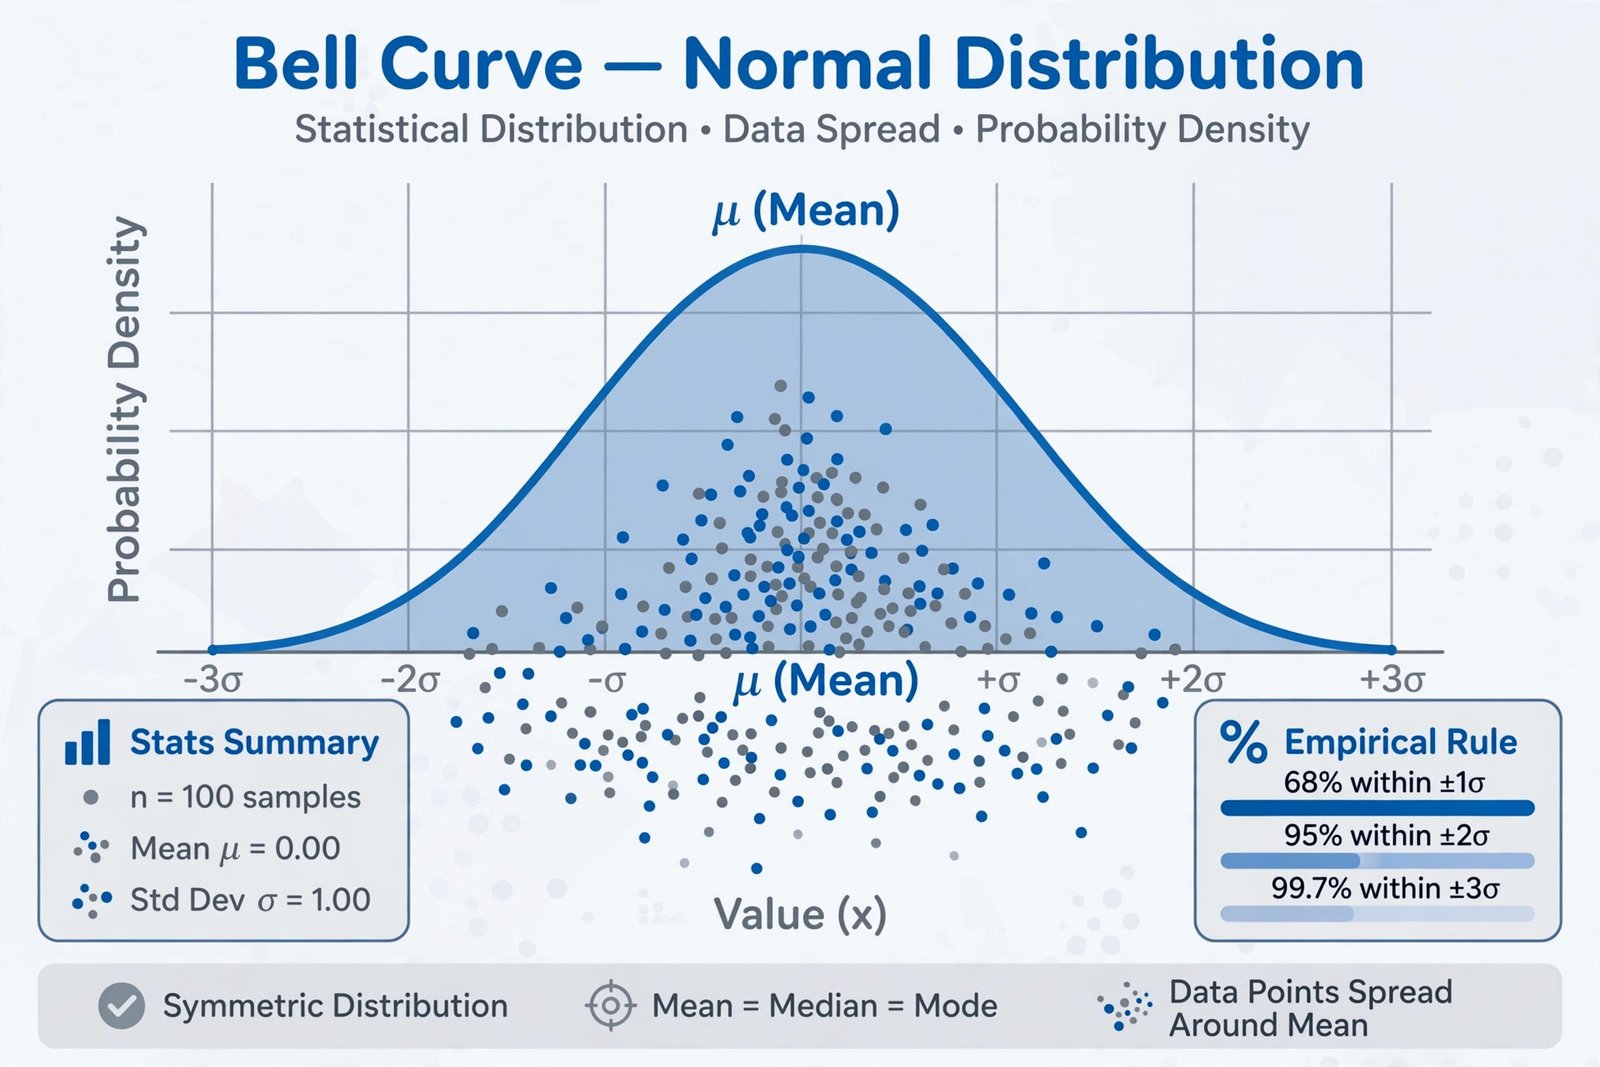
A variance number means little on its own — its power comes from comparison. Compare the variance of this month’s sales against last month’s to see whether revenue is stabilizing. Compare two machines’ output variance to decide which production line needs calibration. A useful trick is the empirical rule for roughly bell-shaped data: about 68 percent of values fall within one standard deviation of the mean, 95 percent within two, and 99.7 percent within three. So if your calculator reports a standard deviation of 10 around a mean of 100, you can expect most values between 90 and 110. When the standard deviation exceeds the mean itself, your data is extremely spread out relative to its center — common in income data, website traffic, and other skewed distributions — and you should consider working with medians or transformed values instead.
Tips and Limitations
Variance is sensitive to outliers because deviations are squared — a single extreme value can dominate the result. If your data has outliers, consider also looking at the median and interquartile range, which resist distortion. Variance also assumes your data is numeric and measured on an interval scale; it is meaningless for categories like colors or names. Finally, remember that variance describes spread, not shape: two very differently shaped distributions can share the same variance, so always plot or inspect your data when the shape matters.
Frequently Asked Questions
What is the difference between population variance and sample variance?
Population variance is used when your data includes every member of the group you are studying, and it divides the sum of squared deviations by n. Sample variance is used when your data is only a subset of a larger group, and it divides by n minus 1 to correct for the tendency of samples to underestimate true spread. Use population variance for complete data sets and sample variance when estimating from a sample.
How do I calculate variance step by step?
First, find the mean of your numbers. Second, subtract the mean from each number and square each result. Third, add up all the squared values. Fourth, divide by the count of numbers for population variance, or by the count minus one for sample variance. The calculator above performs all four steps automatically and shows the working.
What is the relationship between variance and standard deviation?
Standard deviation is the square root of variance. Variance is expressed in squared units, which makes it mathematically convenient but hard to interpret. Taking the square root returns the spread to the original units of your data. Both describe the same dispersion; variance is preferred in formulas, standard deviation in plain-language reporting.
Can variance be negative?
No. Variance can never be negative because it is computed from squared deviations, and squares are always zero or positive. If you ever get a negative variance, there is an arithmetic error — most commonly a missed squaring step or a sign mistake. A variance of zero means all values in the data set are identical.
Why is variance sensitive to outliers?
Because deviations are squared before averaging, large deviations contribute disproportionately. A single value far from the mean can dominate the entire variance. If your data contains outliers, check the median and interquartile range alongside variance, or consider whether the outlier should be investigated or removed before analysis.
When should I use variance instead of range?
The range (maximum minus minimum) only uses two values and ignores everything in between, so it is easily distorted and tells you nothing about the distribution. Variance uses every data point, making it far more informative and stable. Use variance whenever you want a reliable summary of spread; reserve the range for quick, rough checks.
What happens to variance if I add or multiply by a constant?
Adding a constant to every value leaves the variance unchanged, because all the deviations stay the same. Multiplying every value by k multiplies the variance by k squared and the standard deviation by the absolute value of k.
What is a good variance value?
There is no universally good or bad variance — it is measured in squared units, so its size only means something next to the scale of your data. Compare the standard deviation with the mean instead: an SD that is small relative to the mean signals tightly clustered data, whatever the raw variance number looks like.