Paste your numbers below, separated by commas, spaces or line breaks. The generator works out the five-number summary with Tukey quartiles, flags outliers with the 1.5 × IQR rule, and draws a clean box and whisker plot you can read at a glance.
What Is a Box Plot?
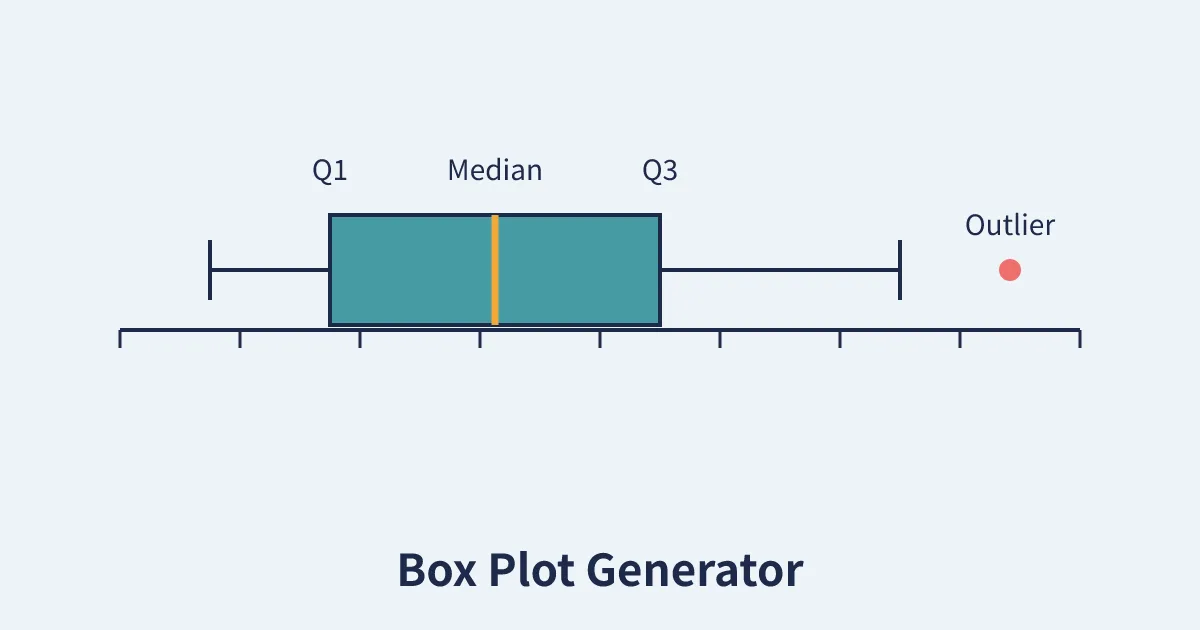
A box plot, also called a box and whisker plot, summarises a set of numbers with a single compact picture. The box itself stretches from the first quartile (Q1) to the third quartile (Q3), so it contains the middle half of your data. A line inside the box marks the median, the whiskers reach out to the most extreme ordinary values, and any points that fall far beyond the whiskers are plotted individually as outliers. With one glance you can judge the centre of the data, how spread out it is, whether it leans to one side, and whether anything unusual is hiding in it.
A box and plot generator does the arithmetic for you. Paste in raw numbers, from test scores to daily temperatures to delivery times, and it returns the five-number summary (minimum, Q1, median, Q3, maximum), the interquartile range, the outlier fences and the finished diagram, all computed the same standard way every time.
How to Use the Box Plot Generator
- Paste your data. Numbers can be separated by commas, spaces, tabs or line breaks, so data copied straight from a spreadsheet works as it is.
- Click Draw Box Plot. The tool sorts your values, computes the summary statistics and renders the chart.
- Read the table first. The statistics table gives you exact figures for reports and homework, while the chart gives you the shape of the data.
- Check the outliers. Any value beyond the fences is listed by name in the table and drawn as a red dot on the plot, so you can decide whether it is an error or a genuinely interesting case.
How the Quartiles Are Calculated
Different textbooks and calculators use slightly different quartile recipes, so this tool states its method openly: it uses the Tukey hinge method with the median excluded, the convention taught in most school textbooks and used by the TI-84 calculator family. The data is sorted, the median is found, and the values are split into a lower half and an upper half. When the count is odd, the median itself belongs to neither half. Q1 is the median of the lower half and Q3 is the median of the upper half.
The interquartile range is IQR = Q3 − Q1. Outliers follow Tukey's fence rule: any value below Q1 − 1.5 × IQR or above Q3 + 1.5 × IQR is an outlier. The whiskers then stop at the most extreme values that are still inside the fences, which is why a whisker rarely reaches the true minimum or maximum when outliers are present. If you compare results with a statistics package that uses percentile interpolation instead, expect small differences in Q1 and Q3; the median and the overall story of the plot will agree.
Worked Example
Take the sample data loaded in the tool: 10, 12, 14, 15, 16, 17, 18, 19, 20 and 100. The median of the ten values is 16.5. The lower half (10 to 16) has median 14, so Q1 = 14, and the upper half (17 to 100) has median 19, so Q3 = 19. The IQR is 5, which puts the fences at 6.5 and 26.5. The value 100 sits far beyond the upper fence, so it is plotted as an outlier and the upper whisker stops at 20, the largest ordinary value. The mean, pulled up by that single large value, is 24.1, well above the median, which is exactly the kind of distortion a box plot exposes instantly.
When Box Plots Beat Averages
An average hides shape. Two classes can share the same mean score while one is tightly clustered and the other is split between high flyers and strugglers. A box plot for each class shows the difference immediately: compare the medians for typical performance, the box lengths for consistency, and the whiskers and outliers for the extremes. Teachers comparing groups often pair a plot like this with a plan of who sits where using our Seating Chart Generator, and anyone collecting data over time can schedule fair sampling days with the Random Date Generator. For a lighter take on data about invented subjects, the Random Character Generator produces character stats you can summarise with this very plot.
Common Mistakes to Avoid
- Too little data. A box plot needs at least four or five values to mean anything, and quartiles from tiny samples jump around. This tool asks for at least four numbers.
- Deleting outliers automatically. An outlier is a flag to investigate, not proof of an error. A genuine record-breaking value belongs in your analysis.
- Mixing quartile methods. When you compare your figures with a classmate or a spreadsheet, check that both sides used the same quartile convention before arguing about the answer.
- Reading the box as a bar chart. The box shows quartiles, not counts. A long box means the middle data is spread out, not that there is more of it.
Reading a Box Plot, Step by Step
Start at the line inside the box: that is the median, the middle value of the data, and it tells you the typical result. In the worked example above, half the values fall below 16.5 and half above. Next, look at the box itself. Its left edge is Q1 and its right edge is Q3, so the box covers the middle half of all observations, and its length is the interquartile range. A short box means the middle values agree closely; a long box means they are spread out.
Then read the whiskers. They run from the box to the most extreme values that are not outliers, so the full whisker-to-whisker span shows the range of ordinary behaviour. If one whisker is much longer than the other, the data is skewed in that direction: a long right whisker with a short box huddled on the left means most values are small with a tail of large ones, the classic shape of incomes, waiting times and website traffic.
Finish with the dots. Each dot beyond the whiskers is an outlier, a value more than 1.5 × IQR past the box. Outliers deserve a question, not automatic deletion. Was the measurement recorded wrongly? Did something unusual genuinely happen that day? In the sample data, the value 100 among values from 10 to 20 is why the mean (24.1) sits so far above the median (16.5): one extreme point dragged the average with it, while the box plot kept its composure.
Box plot or histogram?
The two charts answer different questions. A histogram shows the shape of the data, its peaks and gaps, but takes room and works poorly for comparisons. A box plot compresses a distribution into five numbers, losing the peaks but winning the comparisons: ten box plots can sit side by side on one axis where ten histograms would be unreadable. Summarise one dataset in detail with a histogram; compare several groups at a glance with box plots.
Frequently Asked Questions
What is the five-number summary?
It is the five values a box plot is built from: the minimum, the first quartile (Q1), the median, the third quartile (Q3) and the maximum. Together they describe the centre and spread of a dataset in one short list.
Which quartile method does this generator use?
It uses Tukey's hinge method with the median excluded from both halves, the convention used by most textbooks and TI-84 calculators. Q1 is the median of the lower half of the sorted data and Q3 is the median of the upper half.
How are outliers decided?
With the standard 1.5 × IQR rule. Values below Q1 − 1.5 × IQR or above Q3 + 1.5 × IQR are outliers. They are drawn as individual red dots and listed in the statistics table.
How many numbers do I need for a box plot?
The tool accepts four or more values. In practice, ten or more values give quartiles that are stable enough to interpret with confidence.
Can I paste data from Excel or Google Sheets?
Yes. Copy a column or row of numbers and paste it in. Commas, spaces, tabs and line breaks are all accepted as separators, and anything that is not a number is ignored.
Why is my whisker shorter than the minimum or maximum?
Because whiskers stop at the most extreme values inside the outlier fences. If your minimum or maximum lies beyond a fence, it is drawn as an outlier dot instead, and the whisker ends at the last ordinary value.
Is the box plot generator free?
Yes. It is free, needs no account, and all calculations happen in your browser, so your data never leaves your device.