Turn a picture into a crochet chart you can actually stitch from. This crochet pattern generator from image rebuilds a photo, drawing or logo as a stitch grid: you choose the width in stitches and how many yarn colors to allow, and the tool matches every square to a named yarn shade, counts the stitches in each color, and writes out every row for you.
No image chosen yet. Simple pictures with bold shapes and a plain background make the cleanest charts.
Your image is processed locally in your browser: it is never uploaded, stored or shared. Transparent parts of an image are treated as the white background shade.
What Is a Crochet Graph Pattern?
A crochet graph pattern — also called a graphghan pattern, a pixel crochet chart or a tapestry crochet chart — is a picture rebuilt on a grid. Every square stands for exactly one stitch, and the color of the square tells you which yarn to work that stitch with. The pattern is the picture itself: you follow the squares row by row and the image appears in your fabric as you work.
Graph patterns are the standard way to make picture blankets (graphghans), wall hangings, cushion covers, bags and tapestry-style panels. They suit single crochet best, because a single crochet stitch is close to square, so the picture is not stretched. The same grid guides tapestry crochet, where you carry unused colors inside your stitches, and can serve as a motif reference for corner-to-corner (C2C) work, although C2C is stitched diagonally in blocks rather than square by square. A generator does the tedious part for you: shrinking the image to stitch size, choosing its yarn shades, counting every stitch, and writing the rows out in order.
How to Use This Crochet Pattern Generator
- Choose an image. Pick a photo, drawing, logo or piece of clipart from your device. Bold shapes and strong contrast work best. Nothing is uploaded — the file is read locally by your browser.
- Set the chart width in stitches. The width slider runs from 20 to 120 stitches. The number of rows follows your picture's proportions, so the image is never squashed or stretched. A narrow chart is a quick panel; a wide one is blanket territory.
- Set the number of yarn colors. The color slider runs from 2 to 24. Every square is matched to the nearest of 42 named yarn shades; if your picture needs more shades than your limit, the most-used shades are kept and the rest fold into the closest kept shade.
- Press "Make my chart". You get the chart, a legend listing each shade with its symbol, hex code and stitch count, and a row-by-row instruction list. Check the legend first: if an important color has only a handful of stitches, adjusting the width or color limit may read better.
- Download or work from the screen. Save the chart as a PNG to print or keep on your phone, then work from Row 1 upwards, following the written rows.
How to Read a Stitch Chart
Start at the bottom. Crochet fabric grows upwards, so Row 1 is the chart's bottom row, and the row numbers beside the grid count up from there. Each instruction line is labeled with its row number, side, and reading direction.
Odd rows are right-side (RS) rows, read right to left — the direction you actually crochet them if you are right-handed. Even rows are wrong-side (WS) rows, read left to right, because you have turned the work around. The instruction list already flips each row into its reading order, so you can follow the runs from first to last.
Each run is written as a symbol and a stitch count, such as "A x 6" — work six stitches in the shade the legend assigns to symbol A. Symbols are printed inside the chart squares too, so the chart still reads clearly printed in black and white. Heavier grid lines every ten stitches help you keep your place on wide charts.
Color changes happen mid-row. You change yarn on the last yarn-over of the stitch before the new color starts, so the new color sits on top of the next stitch. For a color in several separate patches on one row, most crocheters use a small separate ball or bobbin per patch instead of carrying yarn across the back; carrying is the tapestry approach and gives a thicker, sturdier fabric. Either way, the counts never change: a chart 40 stitches wide is 40 stitches on every row.
Worked Example: A Simple Heart Chart
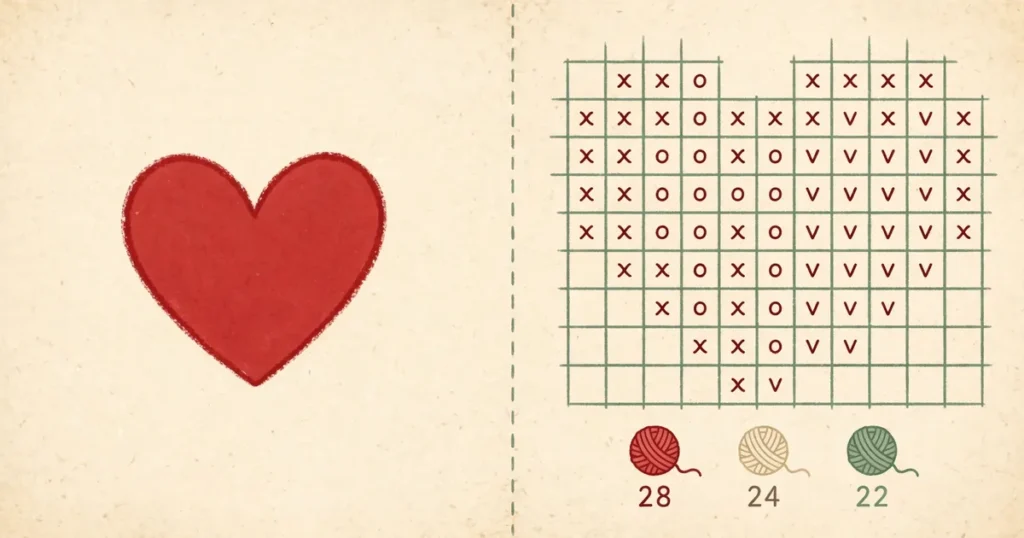
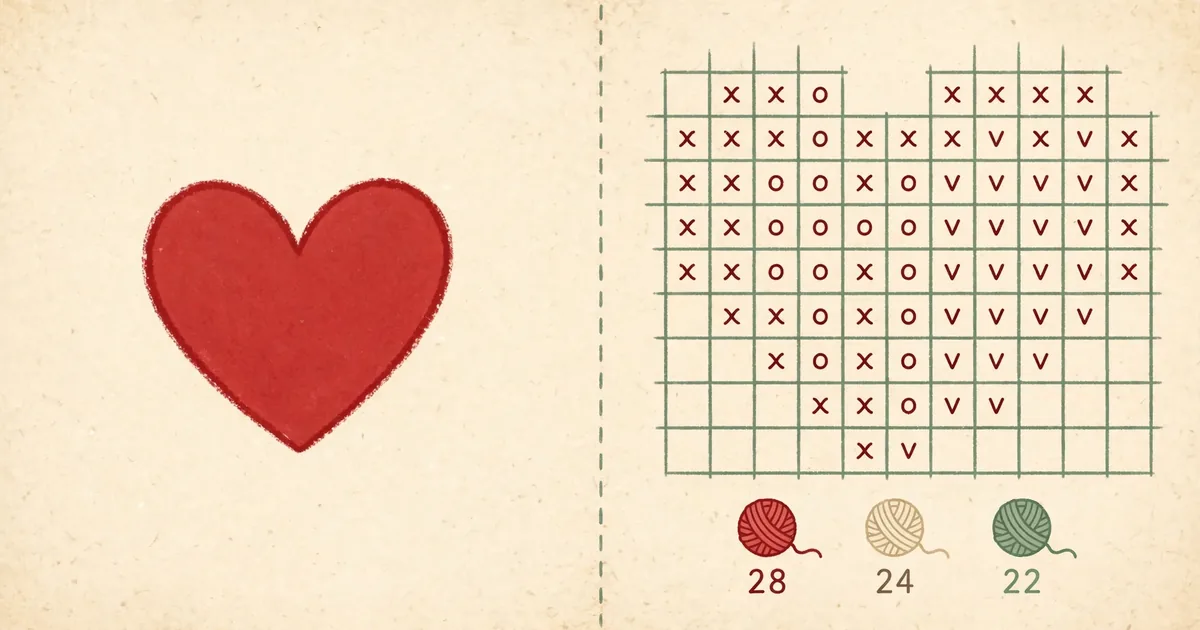
Suppose you feed the generator a plain red heart on a white background, width set to 24 stitches and the color limit at 8. The picture's proportions give a chart 24 stitches wide by 22 rows — 528 stitches in total. Only two shades survive, exactly as you would hope for clip-art: the legend reads A — Crimson Red, 337 stitches (63.8%) and B — Pure White, 191 stitches (36.2%).
The first instruction line is "Row 1 (RS, read right to left): B x 9, A x 6, B x 9" — nine background stitches, the six-stitch point of the heart, nine background stitches. Halfway up, Row 12 reads "B x 2, A x 20, B x 2", the widest part of the heart with a two-stitch border each side, and the last lines taper back to background only as the lobes close. That is the whole workflow in miniature: an image goes in, and out comes a chart you could crochet from immediately — no counting squares by eye, no guessing how much of each color the picture contains.
Choosing Your Stitch Width and Color Count
Width is a trade-off between detail and hours. At 20–40 stitches wide, only bold silhouettes survive — initials, simple animals, a heart or a star — but a chart that size can be finished in an evening or two and suits cushion fronts and wall hangings. At 50–80 stitches, faces, pets and lettering start to read properly. At 90–120 stitches the detail is finer, but a full blanket can run past ten thousand stitches — pick a wide chart only for a project you want to live with for weeks.
Color count is a trade-off between shading and sanity. Two to four colors give a bold, graphic result with few ends to weave in — ideal for a first chart. Five to twelve colors handle most drawings and logos comfortably. Going beyond that mainly adds single-stitch speckles: shades that appear for three or four stitches, each one a color change and two ends to sew in. If the legend shows a shade with fewer than about ten stitches, raising the width (so the detail becomes real shapes) or lowering the color limit (so the speckle folds into a neighbor) usually gives a pleasanter chart, barely different to look at.
Estimating Yarn From Your Stitch Counts
The legend's stitch counts are exact, but yarn yardage is always an estimate — treat any number as a planning figure, not a promise. Usage depends on your yarn weight, hook size, tension and stitch, so no generator can honestly give an exact meterage from a picture alone. What you can do reliably is split a total by color: if Crimson Red is 63.8% of the stitches, it will be roughly 63.8% of the yarn.
For a total you can trust, use the swatch-and-weigh method. Crochet a small test square — say 10 stitches by 10 rows — in your chosen yarn, hook and stitch. Weigh it on a kitchen scale, and weigh a full ball of the same yarn. Your square used (square weight ÷ ball weight) of a ball for 100 stitches; scale that up to your chart's total stitch count, split it by each color's share from the legend, and add a margin for ends and mistakes. It takes five minutes and beats any generic yardage table.
Tips for a Cleaner Chart
- Start with a simple image. One clear subject on a plain background beats a busy photograph every time. Crop tightly around the subject first.
- Try two widths. Generate at your planned width and at about two-thirds of it — the smaller chart is often nearly as readable and much faster to make.
- Mind single stitches. Isolated lone squares of a color look like mistakes in finished fabric; a lower color limit folds most of them away automatically.
- Print in color if you can, but check the symbols — they are your backup when two shades look alike on paper.
Limitations to Know Before You Start
A stitch grid is a coarse way to hold a picture, and some loss is unavoidable. Fine detail — facial features in a small photo, thin lettering, gentle shading gradients — will blur or disappear entirely, and photographs of real scenes chart far worse than drawings, logos and clip-art. The palette is a fixed set of 42 yarn-style shades, so an exact brand shade match is not guaranteed; treat the hex codes as a close guide when you shop, and compare against real yarn in daylight where color matters. Finally, a generated chart is a starting point, not a tested pattern: it has not been crocheted and proofread by a human, so check the first few rows against the chart as you work.
Related Tools
Working with a game build instead of yarn? The Minecraft Pixel Art Generator turns an image into a block-by-block Minecraft chart — the same grid idea, but with game blocks instead of stitches. For a single-color outline you can cut, trace or paint, try the Image to Stencil Converter. If you need a picture to start from, the Random Image Generator can supply one.
Frequently Asked Questions
How do I turn an image into a crochet pattern?
Upload your image above, set the chart width in stitches (20 to 120) and the number of yarn colors (2 to 24), then press "Make my chart". The tool rebuilds your picture as a stitch grid where every square is one single crochet stitch, matches each square to a named yarn shade, and gives you the chart, a color legend with stitch counts, and written row-by-row instructions. Your image is processed in your browser and is never uploaded.
What kind of image works best for a crochet chart?
Simple images with bold shapes, strong contrast and a plain background chart best — drawings, logos, clip-art and silhouettes. Photographs can be used, but fine detail and gentle shading are lost when a picture is reduced to a stitch grid, so a clear, simple subject at a wider chart size gives the most recognizable result.
How many colors should my crochet chart use?
Start low: 2 to 4 colors for a bold graphic chart, 5 to 12 for most drawings and logos. More colors mean more yarn changes, bobbins and ends to weave in, and very high counts mostly add single-stitch speckles rather than real detail. If a shade in the legend has only a few stitches, lowering the color limit usually gives a cleaner chart.
How do I read the chart, and where do I start?
Start at Row 1, which is the bottom row of the chart, and work upwards. Odd rows are right-side rows and are read right to left; even rows are wrong-side rows and are read left to right. Each instruction line lists color runs as a symbol and a stitch count (for example, "A x 6"), and the symbols match the legend and the letters printed in the chart squares.
Can I use this chart for tapestry crochet or C2C?
Yes for tapestry crochet: a tapestry chart is worked from exactly this kind of grid, one single crochet per square, carrying the unused colors inside the stitches. For corner-to-corner (C2C) the chart works as a motif reference, but C2C is stitched diagonally in blocks rather than square by square, so it is not a block-by-block C2C pattern.
How much yarn will I need for my chart?
Only an estimate is possible, because usage depends on your yarn weight, hook and tension. The legend's stitch counts let you split any total by color share, and the reliable way to get a total is the swatch-and-weigh method described above: crochet and weigh a 10 by 10 stitch test square in your yarn, then scale it up to your chart's total stitch count.