How many survey responses you need for a given confidence level and margin of error.
Results are estimates for planning purposes and are not financial, medical, or professional advice.
How to Use the Sample Size Calculator
Before running a survey or experiment, you need to know how many responses make your results trustworthy. This calculator tells you the minimum sample size for your chosen confidence level and margin of error, so you can plan your research budget with confidence.
- Select your confidence level, usually 90, 95, or 99 percent.
- Enter your acceptable margin of error, such as plus or minus 5 percent.
- Enter the estimated population proportion, or leave it at 50 percent for the most conservative estimate.
- Click Calculate. If your total population is small, enter it too so the calculator can apply the finite population correction.
Sample Size Calculator Formula
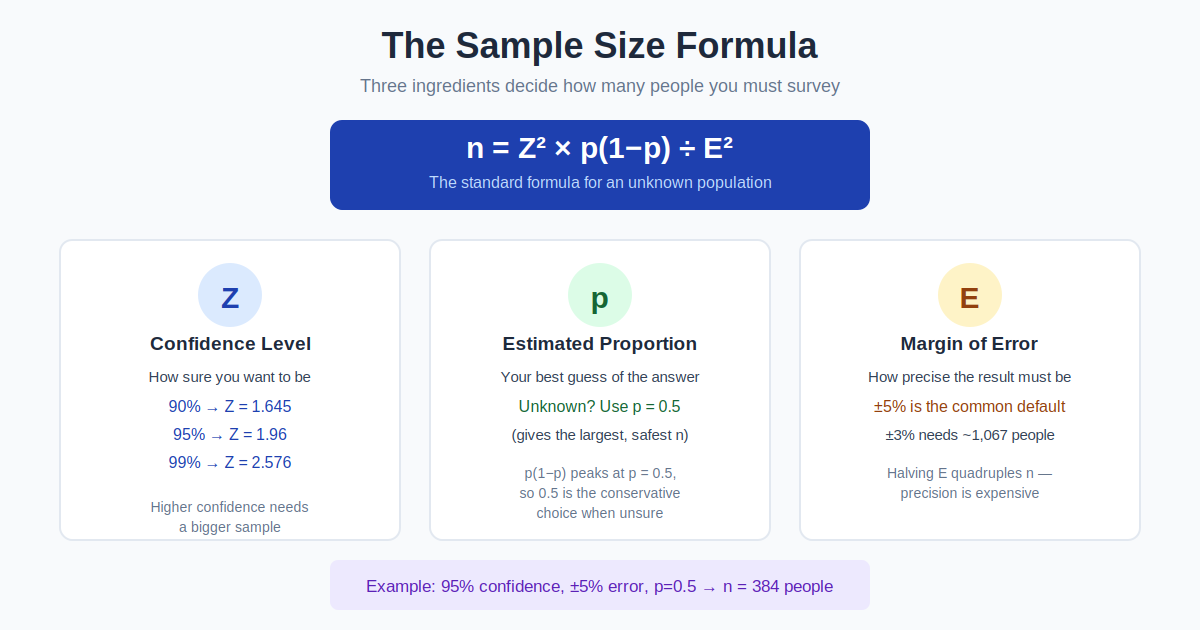
The standard formula is n equals (Z squared times p times (1 minus p)) divided by E squared. Z is the z-score for your confidence level: 1.645 for 90 percent, 1.96 for 95 percent, and 2.576 for 99 percent, p is the estimated proportion, and E is the margin of error as a decimal. Using p equals 0.5 gives the largest, safest sample size when you have no prior estimate. For small populations, the result is adjusted with the finite population correction: adjusted n equals n divided by (1 plus (n minus 1) divided by N), where N is the population size.
Example Calculation
Suppose you want to survey customers with 95 percent confidence and a 5 percent margin of error, and you have no idea what proportion will answer yes. Use Z equals 1.96, p equals 0.5, and E equals 0.05. The numerator is 3.8416 times 0.25, which is 0.9604. Divide by 0.0025 to get 384.16, which rounds up to 385 respondents. If your customer base is only 800 people, the finite correction shrinks the requirement to about 260. Enter these values in the calculator to see both results.
Sample Sizes at a Glance
Required sample sizes for common survey setups, using p equals 0.5 and a large population — every value computed from the formula above and rounded up.
| Margin of error | 90% confidence | 95% confidence | 99% confidence |
|---|---|---|---|
| ±5% | 271 | 385 | 664 |
| ±3% | 752 | 1,068 | 1,844 |
| ±1% | 6,766 | 9,604 | 16,590 |
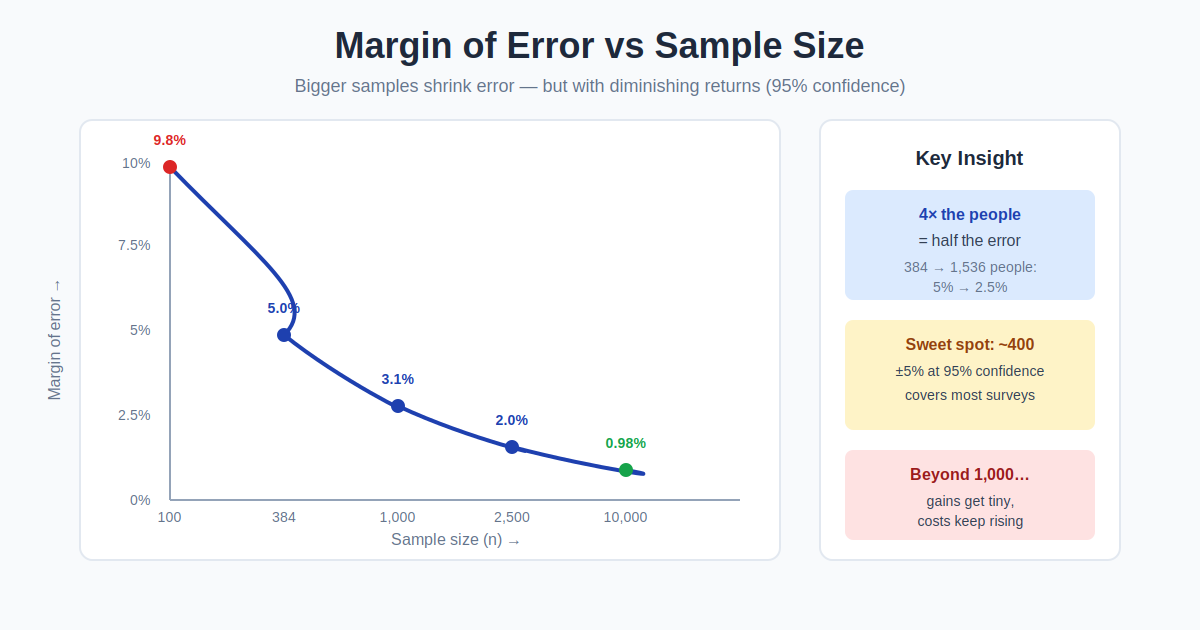
Tightening the margin from ±5% to ±1% multiplies the sample about twenty-five-fold, which is why most surveys settle between ±3% and ±5%.
From Required Responses to Invitations
The result counts completed responses, not invitations. If only some invitees will respond, divide the required sample by the response rate you expect: needing 385 responses at a 40 percent expected rate gives 385 divided by 0.40, which is 962.5, so invite at least 963 people.
Frequently Asked Questions
What confidence level should I choose?
Ninety-five percent is the standard in most fields. Use 99 percent when the decision is high stakes, and 90 percent when you need a quick directional read on a tight budget.
What does margin of error actually mean?
A 5 percent margin of error means the true population value is likely within 5 points of your survey result. Smaller margins need much larger samples.
What proportion do I enter if I have no prior data?
Use 50 percent. It produces the largest required sample, which guarantees your margin of error holds no matter what the true proportion turns out to be.
My population is only a few hundred people. Does that change things?
Yes. When your sample would be a large fraction of the population, the finite population correction reduces the required sample size, sometimes dramatically.
Why does halving the margin of error quadruple the sample size?
Because the margin of error is squared in the denominator. Cutting E from 5 percent to 2.5 percent multiplies the required sample by four.
What sample size do I need for a population of 1,000?
278 responses at 95 percent confidence, a 5 percent margin of error, and p at 50 percent. The finite population correction trims the usual 385 because the sample is a large share of 1,000 people.
How many people should I invite to reach my sample size?
Divide the responses you need by the expected response rate: 385 responses at 40 percent means 385 divided by 0.40, or 962.5, so invite at least 963 people.
Related Calculators
Try our Percentage Calculator, Standard Deviation Calculator, and Confidence Interval Calculator for more statistics tools.