Project compound growth with custom rates and compounding frequency.

How to Use the Compound Growth Calculator
Compound growth is the engine behind long-term investing, savings accounts, and even population models: gains earn their own gains, creating a snowball effect. This calculator projects how an initial amount grows over time at a steady rate, with optional regular contributions and adjustable compounding frequency.
- Enter the starting principal. This is the lump sum you begin with — it can be zero if you are starting from scratch with contributions only.
- Set the annual growth rate. Use a realistic long-term figure: around 7% for stock-heavy investing, 3–4% for bonds, or 0.5–5% for savings accounts depending on the era.
- Choose the time horizon and compounding frequency. Longer horizons and more frequent compounding both accelerate growth. Monthly is the most common choice for savings projections.
- Add regular contributions (optional). Enter any amount you plan to add each period — this is where most real-world growth comes from — then calculate to see the year-by-year projection.
Compound Growth Calculator Formula
The core of compound growth is the formula A = P(1 + r/n)^(nt), where A is the final amount, P is the principal, r is the annual rate as a decimal, n is the number of compounding periods per year, and t is the number of years. Each period, the balance is multiplied by (1 + r/n), so growth itself starts earning growth from the very next period. This is what separates compounding from simple interest, which pays only on the original principal.
When you add regular contributions, the calculator layers the future value of an annuity on top: FV = PMT × [((1 + r/n)^(nt) − 1) ÷ (r/n)], where PMT is the contribution per period. Each contribution compounds for the time remaining after it is made, so early contributions matter far more than late ones — money invested in year one compounds for the full horizon, while money invested in the final year barely grows at all.
A handy mental shortcut is the Rule of 72: divide 72 by the annual rate to estimate the doubling time in years. At 7%, money doubles roughly every 10.3 years; at 10%, every 7.2 years. It is an approximation, but it captures the most important intuition about compounding — small rate differences, sustained over decades, produce enormous outcome differences.
Example Calculation
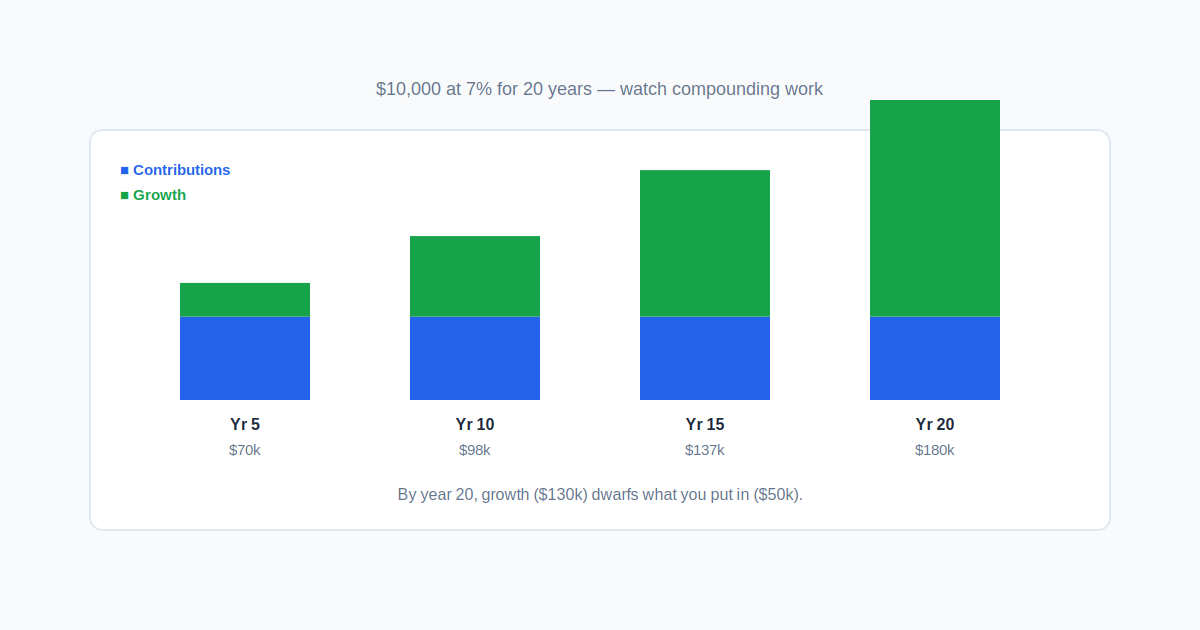
Imagine you invest $10,000 at a 7% annual return, compounded monthly, for 20 years, with no additional contributions. The monthly rate is 0.07 ÷ 12 ≈ 0.005833, and there are 240 periods. Applying the formula: $10,000 × (1.005833)^240 ≈ $10,000 × 4.0387 ≈ $40,387. Your money roughly quadrupled — and $30,387 of that is pure compound growth, triple your original deposit.
Now add $200 per month. Those contributions total $48,000 over 20 years, and their future value is $200 × [((1.005833)^240 − 1) ÷ 0.005833] ≈ $200 × 520.9 ≈ $104,185. Combined with the original $10,000’s growth, the final balance is about $144,573 — from $58,000 of total deposits. That gap is the miracle of compounding.
The $144,573 above is a nominal figure — it ignores that prices rise while your money grows. At 3% annual inflation over 20 years, divide by (1.03)20 ≈ 1.81, and the balance buys what about $80,046 buys today. That is still roughly 38% more purchasing power than the $58,000 deposited — but inflation took the biggest single bite. For real planning, either use an inflation-adjusted return or discount the result the way this paragraph does.
Frequently Asked Questions
Does compounding frequency really matter?
Modestly. Moving from annual to monthly compounding at 7% adds about 0.2 percentage points of effective yield; daily adds a touch more. The differences are real but small compared to the effects of the rate itself, the time horizon, and contributions. Continuous compounding is the mathematical limit, barely above daily.
What is the Rule of 72?
A quick estimate: years to double ≈ 72 ÷ annual rate. At 8%, money doubles in about 9 years. It works best for rates between 4% and 12% and is a great sanity check before trusting any projection.
Should I include inflation in the rate?
For planning purchasing power, yes — subtract expected inflation (historically ~3%) from the nominal return to get the real return. A 7% nominal return is roughly 4% in real terms. Our calculator uses nominal figures; mentally discount for inflation.
Why do early contributions matter so much?
Because each dollar compounds for the full remaining time. A dollar invested at age 25 at 7% becomes about $15 by age 65; a dollar invested at 55 becomes only about $2. Time is the most powerful input in the formula.
Is compound growth guaranteed?
No. The formula assumes a constant rate, but real investments fluctuate. Use conservative rates, diversify, and treat projections as planning estimates — excellent for comparing scenarios, not promises of exact outcomes.
Does Compounding Frequency Matter? The Numbers
Compounding frequency is the smallest lever in the formula — but it is still measurable, and this calculator lets you pick it. Here is what $10,000 at 8% for 10 years becomes at each frequency the calculator offers:
| Compounding frequency | Final balance |
|---|---|
| Yearly | $21,589 |
| Quarterly | $22,080 |
| Monthly | $22,196 |
| Daily | $22,253 |
Moving from yearly to monthly adds about $607 — real money, but dwarfed by what an extra year of time or an extra point of return would add. Continuous compounding is the theoretical ceiling, sitting at about $22,255 — barely above daily, which is why the calculator stops at daily. The practical takeaway: choose the frequency that matches how your contributions and statements arrive, then focus your energy on the rate and the time horizon.
Starting Early Beats Saving More
This is the single most valuable comparison in all of personal finance. Take two savers at an 8% annual return, compounded monthly:
- Early starter: $500 a month from age 25 to 65 — 40 years, $240,000 deposited — grows to about $1,745,504.
- Late starter: $1,000 a month from age 35 to 65 — 30 years, $360,000 deposited — grows to about $1,490,359.
The early saver contributed $120,000 less and finished roughly $255,000 ahead. Ten extra years of compounding bought more growth than doubling the monthly deposit. This is why the opening example matters less than your start date — if you are young, time is already your largest asset; if you are starting late, it is exactly why contributions have to be bigger.
What is the difference between compound growth and CAGR?
Direction. Compound growth projects forward: given a rate, what does the money become? CAGR works backward: given the starting and ending values, what constant rate connects them? They are the same formula read in opposite directions. If you know the endpoints and want the rate, use our CAGR Calculator.
What rate of return should I assume?
Use planning ranges, not promises. Long-run US stock markets have averaged roughly 7-10% nominal a year, bonds 3-5%, and savings accounts 0.5-5% depending on the era. Subtract expected inflation (about 3%) for the real, purchasing-power return, then run a conservative case and an optimistic case and plan against the middle. This page is educational math, not investment advice.
Related Calculators
Try our Compound Interest Calculator and CAGR Calculator for more growth math.