Free descriptive statistics calculator: paste comma-separated numbers to get mean, median, mode, standard deviation, min, max and range instantly online.
Results are estimates for planning purposes and are not financial, medical, or professional advice.
How to Use the Statistics Calculator
Paste any list of numbers to get a full descriptive summary: count, mean, median, mode, standard deviation, minimum, maximum, and range — the eight numbers that sketch any dataset in one glance.
- Type or paste your numbers separated by commas.
- Use whole numbers or decimals, positive or negative.
- Press calculate.
- Read the eight summary statistics in the results table.
Statistics Formulas
| Statistic | What it measures | Formula |
|---|---|---|
| Count (n) | Number of values | n |
| Mean | Arithmetic average | Sum ÷ n |
| Median | Middle value | Middle of the sorted list (average the two middle values when n is even) |
| Mode | Most common value | Highest-frequency value |
| Population SD | Typical spread around the mean | √(Σ(x − mean)² ÷ n) |
| Minimum / Maximum | Extremes | min(x), max(x) |
| Range | Total spread | max − min |
This calculator uses the population standard deviation: squared differences are divided by n, not by n − 1. Use it when your data is the whole population of interest; when it is only a sample meant to describe a larger population, a sample standard deviation (divided by n − 1) is the technically correct choice.
Example
For the data 4, 8, 6, 5, 3, 7, 2, 9, the count is 8 and the sum is 44, so the mean is 5.50. Sorted, the middle two values are 5 and 6, so the median is 5.50. No value repeats, so there is no mode. Minimum 2, maximum 9, range 7.
The standard deviation, step by step, with mean 5.50:
| Value | Deviation | Squared |
|---|---|---|
| 4 | −1.5 | 2.25 |
| 8 | +2.5 | 6.25 |
| 6 | +0.5 | 0.25 |
| 5 | −0.5 | 0.25 |
| 3 | −2.5 | 6.25 |
| 7 | +1.5 | 2.25 |
| 2 | −3.5 | 12.25 |
| 9 | +3.5 | 12.25 |
The squared deviations sum to 42. Dividing by 8 (population formula) gives a variance of 5.25, and the square root gives a standard deviation of 2.29. The variance — 5.25 here — is simply the standard deviation squared; this calculator reports the standard deviation, so square it whenever a formula asks for variance.
A Second Example With a Mode
For 2, 4, 4, 4, 5, 5, 7, 9: count 8, sum 40, mean 5.00. Sorted, the middle two values are 4 and 5, so the median is 4.50. The value 4 appears three times — more than any other — so the mode is 4. The squared deviations from the mean (9 + 1 + 1 + 1 + 0 + 0 + 4 + 16) total 32, divided by 8 gives 4, and the population standard deviation is exactly 2.00. Minimum 2, maximum 9, range 7.

Choosing the Right Statistic
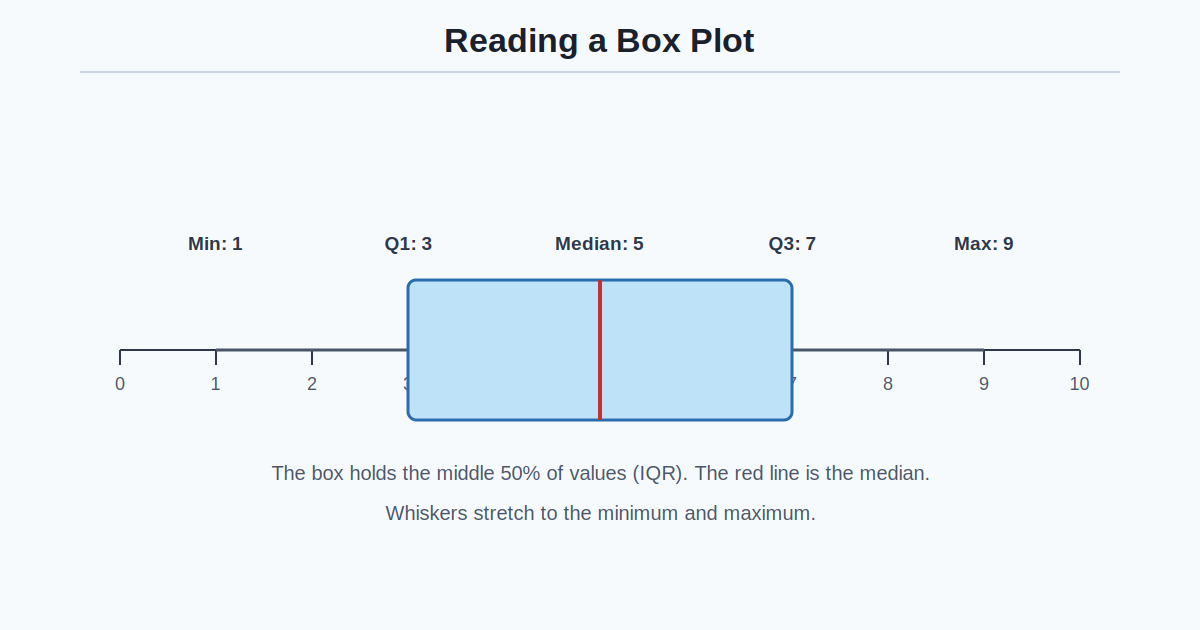
Each summary answers a different question. The mean uses every value, making it efficient but sensitive to outliers: one huge value drags the mean far upward. The median resists extremes, which is why it describes typical house prices and incomes better than any average. The mode reveals the most common case, useful for things like shoe sizes and test scores where repeats carry meaning.
Standard deviation tells you whether data clusters tightly or spreads widely: a small value means consistency, a large one means variability. Compare the mean and median to sniff out skew — in the mode example above, the mean (5.00) sits above the median (4.50), hinting the high values 7 and 9 are pulling the average up. And the range is the quickest spread number of all, but a single outlier stretches it, so pair it with the standard deviation. Report several together: no single number tells the whole story.
Frequently Asked Questions
When should I use median instead of mean?
Use the median when outliers skew the data, such as with incomes or house prices. A single billionaire in a survey of a hundred people barely moves the median but drags the mean far upward, which is why official statistics on pay and property usually quote medians.
What is the difference between population and sample standard deviation?
Population divides by n, sample divides by n minus 1. This calculator uses the population formula.
Can a dataset have more than one mode?
Yes. If two values tie for highest frequency, the data is bimodal. This calculator reports that case.
How many numbers can I enter?
There is no hard limit, but very long lists are easier to manage in a spreadsheet first.
What do I do with negative numbers?
Enter them normally with a minus sign. All formulas handle negatives correctly.
What is variance, and does this calculator show it?
Variance is the average squared distance from the mean — exactly the square of the standard deviation. This calculator reports population standard deviation, so square it to get variance: an SD of 2.29 corresponds to a variance of 5.25.
What does a standard deviation of 0 mean?
It means every value in the data is identical, so nothing strays from the mean at all — for example the set 7, 7, 7, 7. Any spread at all, however small, makes the standard deviation greater than zero.
Related Calculators
Try our Standard Deviation Calculator and Confidence Interval Calculator for more statistics tools.