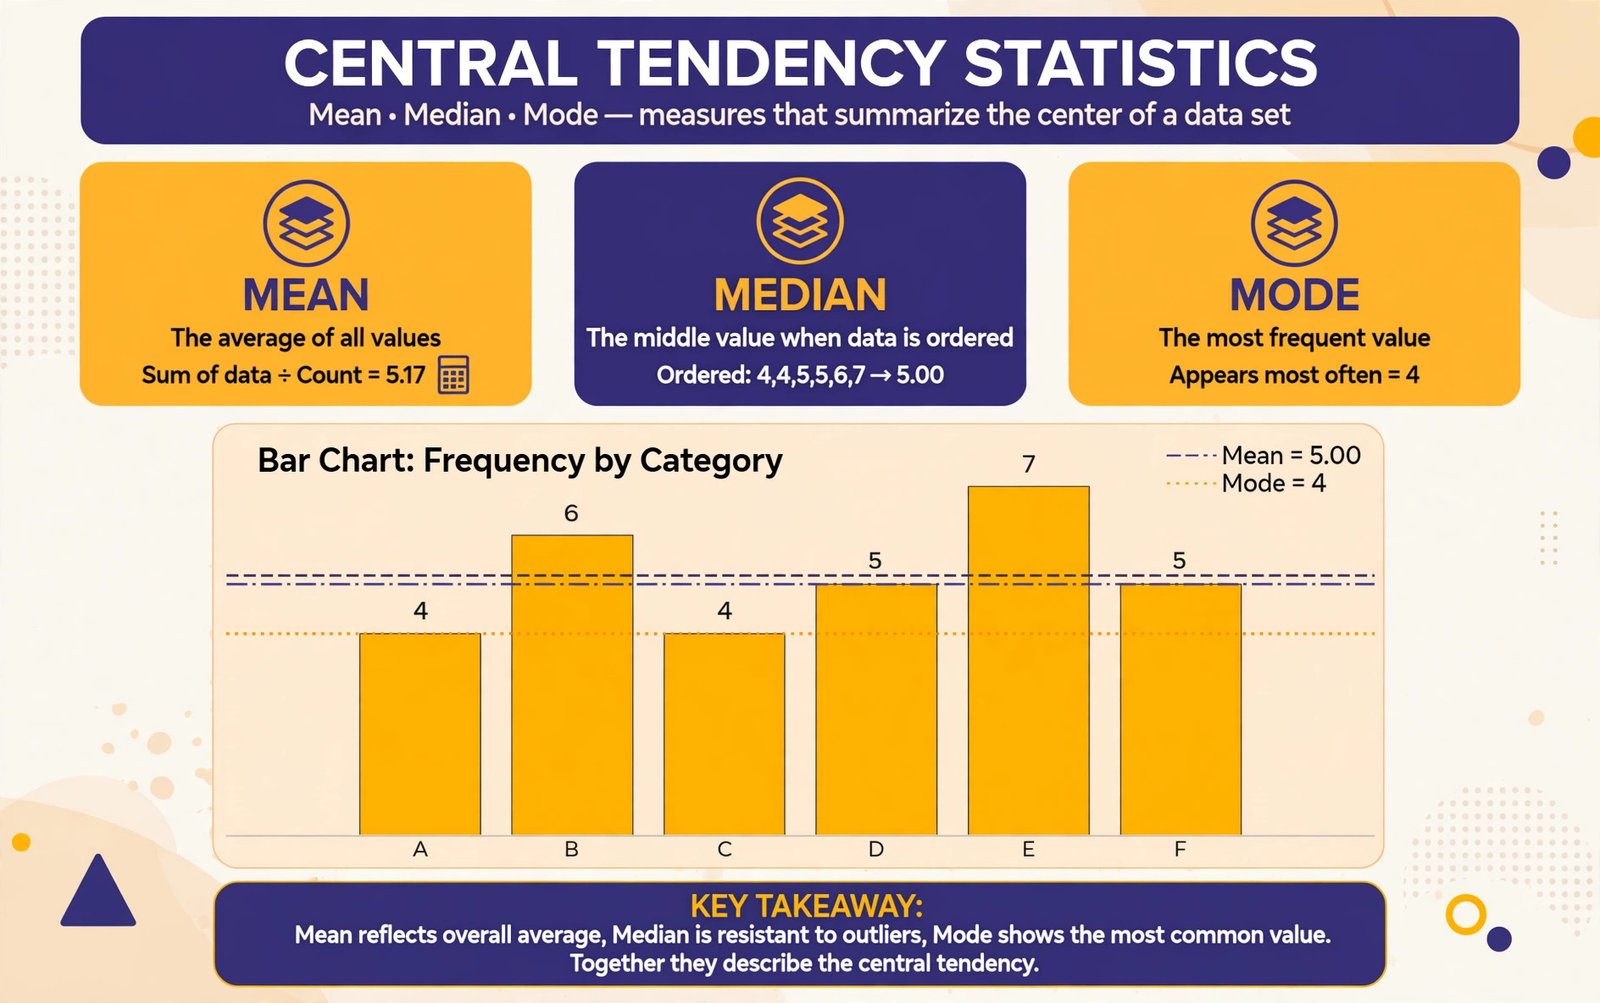
What Are Mean, Median, and Mode?
Mean, median, and mode are the three most common measures of central tendency — single numbers that summarize the “center” of a data set. The mean is the arithmetic average: add all values and divide by how many there are. The median is the middle value when the numbers are arranged in order. The mode is the value that appears most frequently. Each tells a different story, and knowing which one to trust is a core data literacy skill.
Consider the incomes in a small company: nine employees earn 40,000 each and the owner earns 400,000. The mean income is 76,000, which suggests a well-paid workforce — but it describes nobody. The median is 40,000, which reflects the typical employee far better. The mode is also 40,000, the most common paycheck. Same data, three centers, and the right choice depends entirely on what you want to communicate.
This calculator computes all three at once, plus the range, minimum, maximum, quartiles, and a sorted list, so you can compare them side by side instead of guessing which summary fits your data.
How to Calculate Each Measure
The mean
Add every value, then divide by the count. For 3, 7, 7, 2, 9, 5, 7: the sum is 40 and there are 7 values, so the mean is 40 / 7 = 5.7143. The mean uses all data points, which makes it efficient but also sensitive to extreme values.
The median
Sort the values, then take the middle one. For an odd count, it is the exact center value. For an even count, average the two middle values. Sorted, our example is 2, 3, 5, 7, 7, 7, 9 — seven values, so the median is the 4th value: 7. The median ignores extremes, which is why it is the standard choice for skewed data like incomes and house prices.
The mode
Count how often each value occurs; the most frequent wins. In our example, 7 appears three times — more than any other value — so the mode is 7. A data set can have no mode (all values unique), one mode, or several modes. The mode is the only measure of center that works for categorical data, such as the most popular ice cream flavor in a survey.
Range and quartiles
The range is the maximum minus the minimum: 9 − 2 = 7 in our example. Quartiles split sorted data into quarters: Q1 (the first quartile) is the median of the lower half, and Q3 (the third quartile) is the median of the upper half. Here Q1 = 3 and Q3 = 7. The distance between them, the interquartile range, describes the spread of the middle 50 percent of values and resists outliers.
How to Use This Calculator
Step 1: Enter your numbers
Type or paste values separated by commas, spaces, or line breaks. Decimals and negative numbers are accepted.
Step 2: Calculate
Press the button. The calculator sorts your data and instantly reports the count, mean, median, mode, range, minimum, maximum, both quartiles, and the full sorted list.
Step 3: Compare the three centers
If mean, median, and mode are close together, your data is roughly symmetric. If the mean sits well above the median, a few large values are pulling it up (right skew). If it sits below, small values are dragging it down (left skew).
Worked Example
Data: 3, 7, 7, 2, 9, 5, 7. Step 1: sort → 2, 3, 5, 7, 7, 7, 9. Step 2: mean = 40 / 7 = 5.7143. Step 3: median = middle (4th) value = 7. Step 4: mode = 7 (appears 3 times). Step 5: range = 9 − 2 = 7. Step 6: lower half = 2, 3, 5 → Q1 = 3; upper half = 7, 7, 9 → Q3 = 7. The calculator above reproduces every step.
When to Use Mean vs Median vs Mode
Use the mean for symmetric data without extreme outliers: test scores in a typical class, measurement errors, or heights. Use the median for skewed data or data with outliers: salaries, property prices, or waiting times. Use the mode for categorical data or when the most common value is the question: the most frequent customer complaint, the best-selling size, or the typical number of children per family. In formal reporting, presenting all three — as this calculator does — is often the most honest approach, because their disagreement itself reveals the shape of your data.
Understanding Skew Through the Three Measures
The relationship between mean, median, and mode diagnoses skew at a glance. In a symmetric distribution they coincide. In right-skewed data (a tail stretching toward large values, like income), the order is typically mode, then median, then mean — the mean is dragged furthest toward the tail. In left-skewed data (a tail toward small values, like exam scores with a hard maximum), the order reverses: mean, then median, then mode. This quick check helps you decide whether the mean is trustworthy or whether you should lean on the median before running deeper analysis.
Weighted Mean and Trimmed Mean
Not every average treats values equally. A weighted mean assigns importance to each value — exactly how a GPA works, where a 4-credit course counts more than a 1-credit one. To compute it, multiply each value by its weight, add those products, and divide by the sum of the weights. Portfolio returns, grade calculations, and survey results with demographic weighting all rely on this. A trimmed mean goes the other direction: it drops a fixed percentage of the smallest and largest values before averaging the rest, which tames outliers without fully ignoring the tails. Olympic scoring uses a trimmed mean when judges’ highest and lowest marks are discarded. Both are refinements of the ordinary mean for situations where every data point should not count the same — worth knowing when the simple average feels slightly off for your data.
Mean, Median and Mode in Excel and Google Sheets
Spreadsheet programs use one function per measure. For a range such as A1:A10, =AVERAGE(A1:A10) returns the mean, =MEDIAN(A1:A10) the median, and =MODE.SNGL(A1:A10) the single most frequent value (older files may use =MODE, which behaves the same when there is one mode). Google Sheets accepts the same three functions. Two practical notes: these functions ignore empty cells and text entries, which is usually what you want; and MODE.SNGL returns an error when no value repeats, which is the spreadsheet’s way of saying the data set has no mode.
Other Kinds of Average: Geometric and Harmonic Mean
The arithmetic mean is not always the right average. The geometric mean multiplies the values and takes the nth root; it suits growth rates, because returns compound. Growing by 10% one year and 20% the next is an average growth of √(1.10 × 1.20) − 1 ≈ 14.89% per year, not the arithmetic 15%. The harmonic mean suits rates averaged over equal distances: driving to a destination at 40 km/h and back at 60 km/h averages 48 km/h overall, not 50, because more time is spent travelling at the slower speed.
Real-World Applications
Teachers use the mean to compute final grades and the median to check whether a test was too hard — if the median trails the mean badly, a few top students are masking widespread struggle. Real estate listings quote median prices because a handful of luxury sales would inflate the mean beyond what typical buyers face. Manufacturers track the mode of defect types to prioritize fixes: the most common failure deserves attention first. Sports analysts compare a player’s mean and median scores across a season to separate consistent performers from streaky ones. Marketers look at the modal purchase amount to set bundle pricing. In each case, the right measure turns raw numbers into decisions, and the wrong one quietly misleads.
Reading Statistics in News and Research
Headlines love the mean because it sounds authoritative, but informed readers check which measure was used. “Average home price rises 10 percent” might reflect a luxury boom while typical homes stagnate — the median would tell the truer story. Medical studies often report medians for survival times because a few long-term survivors skew the mean upward. When a poll claims the “typical” anything, ask whether typical means mean, median, or mode; the answer changes the conclusion. Developing the habit of asking “which average?” is one of the highest-value critical thinking skills in a data-saturated world, and it starts with understanding exactly what each of these three numbers does.
Common Mistakes to Avoid
A classic error is reporting the mean for heavily skewed data without mentioning the median — the “average salary” of a company including its CEO is the textbook case. Another is treating the mode of a tiny sample as meaningful; with five observations, a repeated value may be pure chance. People also forget that the median of an even-sized set is an average of two middle values, not one of the data points. A subtler trap is comparing means across groups of very different sizes without weighting, which can produce Simpson’s paradox, where each subgroup favors one option but the combined average favors the other. Finally, never average averages: the mean of two group means is only valid if the groups are the same size — otherwise compute from the raw totals.
Tips and Limitations
The mean requires numeric interval data — averaging categories like postal codes is meaningless. The median needs ordered data and at least a sensible middle; with very few values it is jumpy. The mode can be unstable in small samples, where a single repeated value may be coincidence rather than pattern. None of the three measures describes spread, so always pair them with the range, quartiles, or standard deviation when variation matters. Finally, remember that a single center can mislead: always look at the sorted list and the shape of the data before drawing conclusions.
Frequently Asked Questions
What is the difference between mean, median, and mode?
The mean is the arithmetic average of all values. The median is the middle value in sorted order. The mode is the most frequently occurring value. The mean uses every data point but is sensitive to outliers; the median resists outliers; the mode works even for non-numeric categories. Together they give a fuller picture than any one alone.
When should I use the median instead of the mean?
Use the median when your data is skewed or contains outliers — for example, incomes, house prices, or waiting times. In these cases a few extreme values pull the mean away from the typical experience, while the median stays representative. For symmetric data without outliers, the mean and median will be similar and the mean is fine.
Can a data set have more than one mode?
Yes. A data set with two modes is called bimodal, and more than two is multimodal. Multiple modes often signal that the data mixes distinct groups — for example, test scores clustering around two different levels. A data set where every value appears exactly once has no mode at all.
How are quartiles Q1 and Q3 calculated?
Sort the data, then split it into a lower half and an upper half around the median. Q1 is the median of the lower half and Q3 is the median of the upper half. The interquartile range (Q3 minus Q1) captures the spread of the middle 50 percent of values and is resistant to outliers.
Why do mean and median differ in my data?
A gap between mean and median indicates skew. If the mean is higher than the median, large values are pulling it up (right skew, common in income data). If the mean is lower, small values are dragging it down (left skew). When they match closely, the distribution is roughly symmetric.
What is a weighted mean?
A weighted mean gives different values different importance. Multiply each value by its weight, sum those products, and divide by the sum of the weights. GPAs, portfolio returns, and demographically adjusted survey results all use weighted means because not every observation should count equally.
How do I calculate mean, median and mode in Excel?
Use =AVERAGE(range) for the mean, =MEDIAN(range) for the median and =MODE.SNGL(range) for the mode. The same functions work in Google Sheets. If no value in the range repeats, MODE.SNGL returns an error because the data set has no mode.
What is the midrange?
The midrange is (minimum + maximum) ÷ 2 — the midpoint of the data’s span. For the worked example on this page (minimum 2, maximum 9) it is 5.5. Because it uses only the two most extreme values it is easily distorted by outliers, so it is rarely used as a main summary; you can compute it from the minimum and maximum this calculator reports.