
The Number the Average Doesn’t Tell You
An average can hide a lot. Two classrooms can both average 75 on a test — in one, every student scores near 75; in the other, half the class scores 95 and half scores 55. The standard deviation calculator tells you which story your numbers tell: it measures exactly how spread out your values are around their mean, in seconds, for both population and sample data.
Averages lie — not maliciously, but by omission. Standard deviation measures how far, on average, your data points sit from their mean: small SD means values cluster tightly (a sharpshooter’s shots grouping in the bullseye); large SD means values are scattered (shots spread across the whole target).
Separate values with commas, spaces, or one per line. At least 2 numbers are required (3+ for sample mode).
Step-by-step working
Tip: choose Population when your numbers cover the entire group you care about; choose Sample when they are a subset drawn from a larger group.
How to Use This Calculator
- Type or paste your numbers into the box — commas, spaces, or one value per line all work.
- Choose Population (σ) if your numbers are the entire group, or Sample (s) if they are a subset of a larger group.
- Click Calculate Standard Deviation.
- Read the headline result, then scroll for variance, mean, count, sum, min, max — plus a full step-by-step breakdown showing every deviation and squared deviation.
You can edit the numbers or switch between population and sample mode at any time; the results update instantly.
What Is Standard Deviation?
Standard deviation is a single number that summarizes how far your data typically wanders from its average. A small standard deviation means your values cluster tightly around the mean — the data is consistent. A large standard deviation means the values are scattered — the data is volatile.
It is the square root of the variance, which is the average of the squared distances from the mean. Taking the square root converts the measure back into your original units: if you measure test scores, the standard deviation is in "score points"; if you measure heights in inches, it is in inches. That is what makes it so intuitive.
Consider two quiz teams that both average 8 out of 10: Team A: 8, 8, 8, 8, 8 → SD = 0 (perfectly consistent). Team B: 10, 6, 10, 6, 8 → SD = 1.79 (inconsistent). Same average, very different reliability. A coach, a teacher, or an investor all want to know the spread — not just the middle.
The Formulas (With a Worked Example)
There are two formulas, and picking the right one is the single most important step:
σ = √[ Σ(x − μ)² / N ]
Sample standard deviation (s) — use when your data is a sample from a larger group:
s = √[ Σ(x − x̄)² / (n − 1) ]
The sample version divides by n − 1 instead of n (Bessel's correction), because a sample tends to underestimate the true spread. This is the formula your statistics class uses most often.
Worked example: find the sample standard deviation of five delivery times in minutes: 18, 22, 25, 19, 21.
| Step | Work | Result |
|---|---|---|
| 1 — Mean | (18 + 22 + 25 + 19 + 21) ÷ 5 | 21 |
| 2 — Deviations | −3, 1, 4, −2, 0 | — |
| 3 — Squared | 9, 1, 16, 4, 0 | Sum = 30 |
| 4 — Variance (sample) | 30 ÷ (5 − 1) | 7.5 |
| 5 — Std. deviation | √7.5 | ≈ 2.74 minutes |
So deliveries average 21 minutes, typically varying by about 2.7 minutes — nicely consistent. Notice why we square the deviations: it stops negative and positive deviations from cancelling out, and it penalizes large outliers more than small ones. The final square root simply brings everything back to minutes.
The 68–95–99.7 Rule
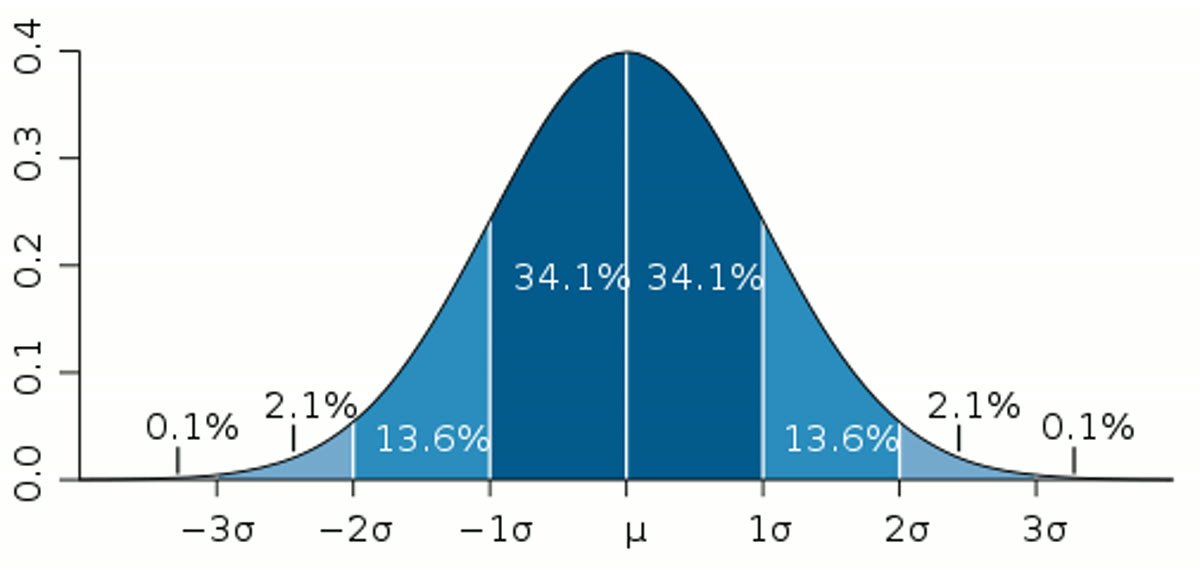
When data follows the familiar bell curve (normal distribution), standard deviation unlocks a famous shortcut: about 68% of values fall within one SD of the mean, 95% within two SDs, and 99.7% within three SDs. So if a test has a mean of 70 and an SD of 5, you immediately know roughly 95% of students scored between 60 and 80 — without seeing a single score.
From Standard Deviation to a Z-Score
Standard deviation is also the measuring stick behind the z-score: z = (value − mean) ÷ SD. It states how many standard deviations a value sits from the mean, which makes totally different datasets comparable on one scale. Take this page's delivery data (mean 21 minutes, SD 2.74): a 25-minute delivery has z = (25 − 21) ÷ 2.74 ≈ 1.46 — slower than typical, but not extreme. As a rule of thumb, |z| above 2 flags an outlier, since only about 5% of bell-curve values land that far out — a 16-minute delivery, by the same math, scores z ≈ −1.82, unusually fast. Compute z-scores directly with our Z-Score Calculator.
Tips for Reading Standard Deviation
- Choose population vs. sample deliberately. Whole class of 30 students → population. 30 students surveyed out of 2,000 → sample. When in doubt for homework, use sample — it is the statistics-class default.
- Outliers dominate. One wild value inflates the standard deviation dramatically because deviations are squared. Glance at the deviations table to spot suspects.
- Compare on the same scale. An SD of 5 means nothing alone — pair it with the mean. SD 5 around a mean of 10 is huge; around a mean of 1,000 it is tiny.
- Zero means identical. If every value is the same, the SD is exactly 0 — a quick sanity check that your data loaded correctly.
- A bigger SD isn't always bad. An investor might accept high volatility for high expected returns; context decides.
- Watch your separators. Mixing commas and decimal points (like "1,5" for one-and-a-half) confuses most tools — use "1.5" and separate values with commas or spaces.
- Compare across scales with relative spread. The coefficient of variation (SD ÷ mean) makes spreads comparable between datasets with different units or magnitudes — the delivery example gives 2.74 ÷ 21 ≈ 13%.
More Math Tools
Frequently Asked Questions
What is the difference between variance and standard deviation?
Variance is the average of the squared deviations from the mean. Standard deviation is its square root. Variance is measured in squared units (awkward), while standard deviation is in your original units — which is why standard deviation is the number people actually report.
When should I use population vs. sample standard deviation?
Use population (σ) when your data includes every member of the group you care about — all 25 employees, all scores in a class. Use sample (s) when your data is a subset and you want to estimate the spread of the larger group — 200 survey respondents representing a city.
Can standard deviation be negative?
No. It is built from squared values, which are never negative, so the result is always zero or positive. If you ever get a negative, something went wrong in the calculation.
What does a standard deviation of zero mean?
Every value in your dataset is identical to the mean — there is no spread at all. Five scores of 80, 80, 80, 80, 80 give an SD of exactly 0.
What is a "good" standard deviation?
There is no universal good value — it depends on context. In manufacturing, smaller is better (consistency). In investing, a higher SD on returns means higher risk. Always judge it relative to the mean and the goal.
Why do we divide by n − 1 for a sample?
A sample drawn from a population tends to cluster a little tighter than the population itself, so dividing by n would underestimate the true spread. Dividing by n − 1 (Bessel's correction) compensates for that bias.
What is a z-score?
A value re-expressed in standard deviations from the mean: z = (value − mean) ÷ SD. A 25-minute delivery in data with mean 21 and SD 2.74 has z ≈ 1.46 — above average, but well inside the usual |z| ≤ 2 range.
How many numbers do I need to calculate a standard deviation?
At least two for a sample: with a single value, the sample formula divides by n − 1 = 0 and is undefined. A one-value population has an SD of 0 by definition, since nothing varies.
Related Calculators